
Data Visualization in Tableau: Create Dashboards and Stories
About this Course
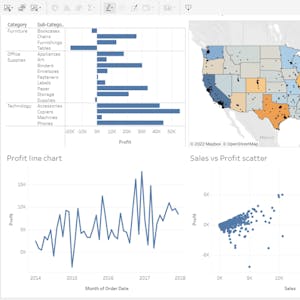
Use Tableau Web Authoring to create best practice dashboards and stories from dataCreated by: Coursera Project Network
Related Online Courses

This course for practicing and aspiring data scientists and statisticians. It is the fourth of a four-course sequence introducing the fundamentals of Bayesian statistics. It builds on the course... more

This course is designed to help Scrum beginners become more proficient with Agile Scrum. This course explores layering other Agile methodologies on top of Scrum. This is the fourth course in the... more

Whether you\'ve traveled before or not, living and working overseas can be challenging. Learn how best to prepare and make the most of your time internationally. This course will prepare you to... more

This course will help you will develop a streamlined, user friendly scheduling tool that will allow you to easily manage client appointments and improve your team and time management. Picktime lets... more

This course covers commonly used statistical inference methods for numerical and categorical data. You will learn how to set up and perform hypothesis tests, interpret p-values, and report the... more
Powered by
![]()

