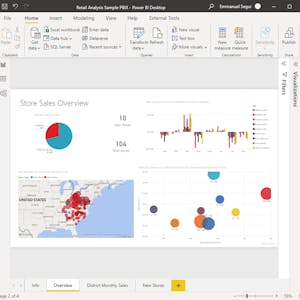
Data Visualization in Power BI: Create Your First Dashboard
About this Course
Connect Power BI to different sources to create interactive dashboards in Power BI. For example, a data analyst can build a dashboard that is interactive and can track key business metrics to help business stakeholders make actionable business decisions.Created by: Coursera Project Network

Related Online Courses
This is a self-paced lab that takes place in the Google Cloud console. Cloud SQL for PostgreSQL Database Observability and TuningCreated by: Google Cloud more
Participants will learn to optimize operations, enhance productivity, and address real-world challenges through strategic planning and effective implementation. The curriculum combines theoretical... more
e.g. This is primarily aimed at first- and second-year undergraduates interested in engineering or science, along with high school students and professionals with an interest in programmingGain the... more
This course is for all enthusiasts and practitioners with a genuine interest in the rapidly developing field of generative AI, which is transforming our world. The course focuses on the core... more
Intended for both Aboriginal and non-Aboriginal learners, this course will explore indigenous ways of knowing and how they can benefit all students. Topics include historical, social, and political... more


