
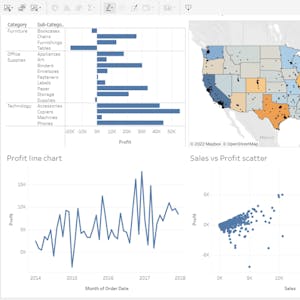
Data Visualization in Tableau: Create Dashboards and Stories
About this Course
Use Tableau Web Authoring to create best practice dashboards and stories from dataCreated by: Coursera Project Network
Related Online Courses
This Specialization is an introduction to the fascinating world of Supply Chain Management. When you complete the program you\'ll have a richer understanding of the complexities that companies are... more
This is a self-paced lab that takes place in the Google Cloud console..In this lab, you will learn how to use Datadog Monitoring with Google Eventarc.Created by: Google Cloud more

This specialization provides in-depth knowledge and hands-on experience in designing and programming embedded systems using C. Learners will master key concepts such as microcontroller interfacing,... more

Wilderness First Aid is for anyone who wants to improve their safety in nature. In this specialization, you will find basic emergency medical care to help stabilize or evacuate injured or ill... more

This course is all about presenting the story of the data, using PowerPoint. You\'ll learn how to structure a presentation, to include insights and supporting data. You\'ll also learn some design... more
Powered by
![]()

