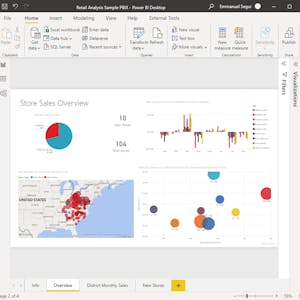
Data Visualization in Power BI: Create Your First Dashboard
About this Course
Connect Power BI to different sources to create interactive dashboards in Power BI. For example, a data analyst can build a dashboard that is interactive and can track key business metrics to help business stakeholders make actionable business decisions.Created by: Coursera Project Network

Related Online Courses
Docker management in the Cloud is a valuable skill to have if you want to be a Docker administrator, a Docker user, or just want to learn more about Docker in the Cloud. Many businesses have... more
This Teradata Specialization offers comprehensive training in data management, SQL proficiency, and performance optimization using Teradata. Learners will gain in-depth knowledge of Teradata... more
This course is for experienced C programmers who want to program in C++. The examples and exercises require a basic understanding of algorithms and object-oriented software.Created by: University... more
The third course in this Specialization introduces you to the factors that influence how effective boards of directors will be in carrying out their roles and responsibilities and hence the impact... more
By the end of this guided project, you will be fluent in creating Program Change Management artefacts for the Planning Phase for diverse programs. You will utilise a logical diagramming plan in an... more


