
A Simple Scatter Plot using D3 js
About this Course
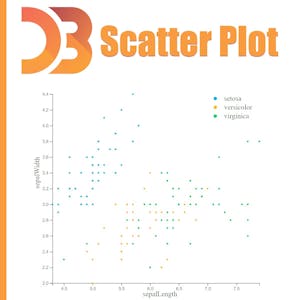
During this guided project, you will create a simple scatter plot using D3 js. Starting from loading our dataset we are going to cover some steps in order to create a fully functional scatter plot. We will also cover some important topics in data visualization such as Linear and Ordinal scaling to best visualize our data. Having the knowledge of javascript programming language and the basics of d3 js are the two most important prerequisites to get the most out of this guided project.Created by: Coursera Project Network
Related Online Courses
Plastic electronics is a concept that emerged forty years ago, with the discovery of electrically conductive polymers. Ten years later, the first electronic devices using organic solids in place of... more

Crisis Communications is designed to empower professionals with the knowledge and skills to effectively navigate and respond to crisis situations through interviews.Created by: IESE Business School more

In today\'s technology-driven world, automation is a valuable skill for everyone. This course, \"Automation for Everyone,\" allows you to harness the power of automation. From automating home tasks... more
This is a self-paced lab that takes place in the Google Cloud console. Learn how to use BigQuery Machine Learning with remote models (Gemini AI) to analyze customer reviews using Python... more

This course explores the integration of Flexible Manufacturing Systems (FMS) with Lean Manufacturing principles, emphasizing how a lean transformation facilitates robotics and automation.... more
Powered by
![]()

