Advanced Data Visualization with R
About this Course
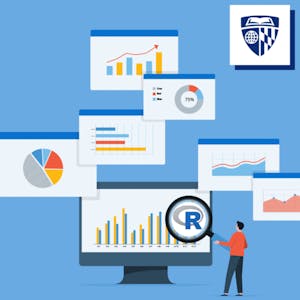
Data visualization is a critical skill for anyone that routinely using quantitative data in his or her work - which is to say that data visualization is a tool that almost every worker needs today. One of the critical tools for data visualization today is the R statistical programming language. Especially in conjunction with the tidyverse software packages, R has become an extremely powerful and flexible platform for making figures, tables, and reproducible reports. However, R can be intimidating for first time users, and there are so many resources online that it can be difficult to sort through without guidance. This course is the third in the Specialization \"Data Visualization and Dashboarding in R.\" Learners come into this course with a foundation using R to make many basic kinds of visualization, primarily with the ggplot2 package. Accordingly, this course focuses on expanding the learners\' inventory of data visualization options. Drawing on additional packages to supplement ggplot2, learners will made more variants of traditional figures, as well as venture into spatial data. The course ends make interactive and animated figures. To fill that need, this course is intended for learners who have little or no experience with R but who are looking for an introduction to this tool. By the end of this course, students will be able to import data into R, manipulate that data using tools from the popular tidyverse package, and make simple reports using R Markdown. The course is designed for students with good basic computing skills, but limited if any experience with programming.Created by: Johns Hopkins University

Related Online Courses
This course provides learners with a baseline understanding of common cyber security threats, vulnerabilities, and risks. An overview of how basic cyber attacks are constructed and applied to real... more
This specialization is intended for those interested in sports marketing, sports administration, the MLB, and American culture & globalization. It is highly beneficial to those interested in... more
This Specialization is for learners who want to learn how to identify, analyze, and solve business problems using spreadsheet models. In addition, learners will use mathematical tools to discover... more
In this guided project, you will learn the art of text summarization using the well-known GenAI framework, Langchain, and transform it into a practical, real-world web application with Streamlit.... more
Gemini for Google Workspace is an add-on that provides customers with generative AI features in Google Workspace. In this mini-course, you learn about the key features of Gemini and how they can be... more


