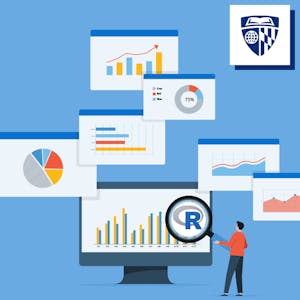
Data Visualization & Dashboarding with R
About this Specialization
This Specialization is intended for learners seeking to develop the ability to visualize data using R. Through five courses, you will use R to create static and interactive data visualizations and publish them on the web, which will you prepare you to provide insight to many types of audiences.Created by: Johns Hopkins University

Related Online Courses
Welcome to the final course of lectures in your quest to master EMT basics. In this course, we will cover some of the highest-stress patient populations: pregnant patients and kids, also known as... more
The aim of this course is to introduce learners to open-source R packages that can be used to perform clinical data reporting tasks. The main emphasis of the course will be the clinical data flow... more
In this course, you will explore the foundations upon which modern-day ESG was built, how market forces react to ESG, and ways to create and maintain value using ESG investment strategies. You will... more
Anti-Racism II is an intermediate course between Anti-Racism I and Anti-Racism III, focusing on the topic of race, racism, and strategies regarding how to be an anti-racist. Anti-Racism II is for... more
With the exponential growth of user-generated data, mastering RNNs is essential for deep learning engineers to perform tasks like classification and prediction. Architectures such as RNNs, GRUs,... more


